

Introduction
The Four-Color Problem states that any map can be coloured using no more than four colours so that no two adjacent regions share the same color.
This problem can be solved using the DSATUR algorithm, which is a specialized greedy algorithm for graph colouring.
DSATUR stands for Degree of Saturation. This algorithm is efficient and often finds a solution with the minimum number of colours.
.
Problem Statement
“You are given a map of a country with several states. Your task is to color the map using no more than four colours such that no two adjacent states share the same color.”
This problem can be represented as a graph colouring problem where each state is a vertex, and each border between two states is an edge. Implement this using the DSATUR (Degree of Saturation) algorithm.
Constraints –
- The graph is connected.
- No two regions that share a border can have the same color.
- The maximum number of colours to be used is four.
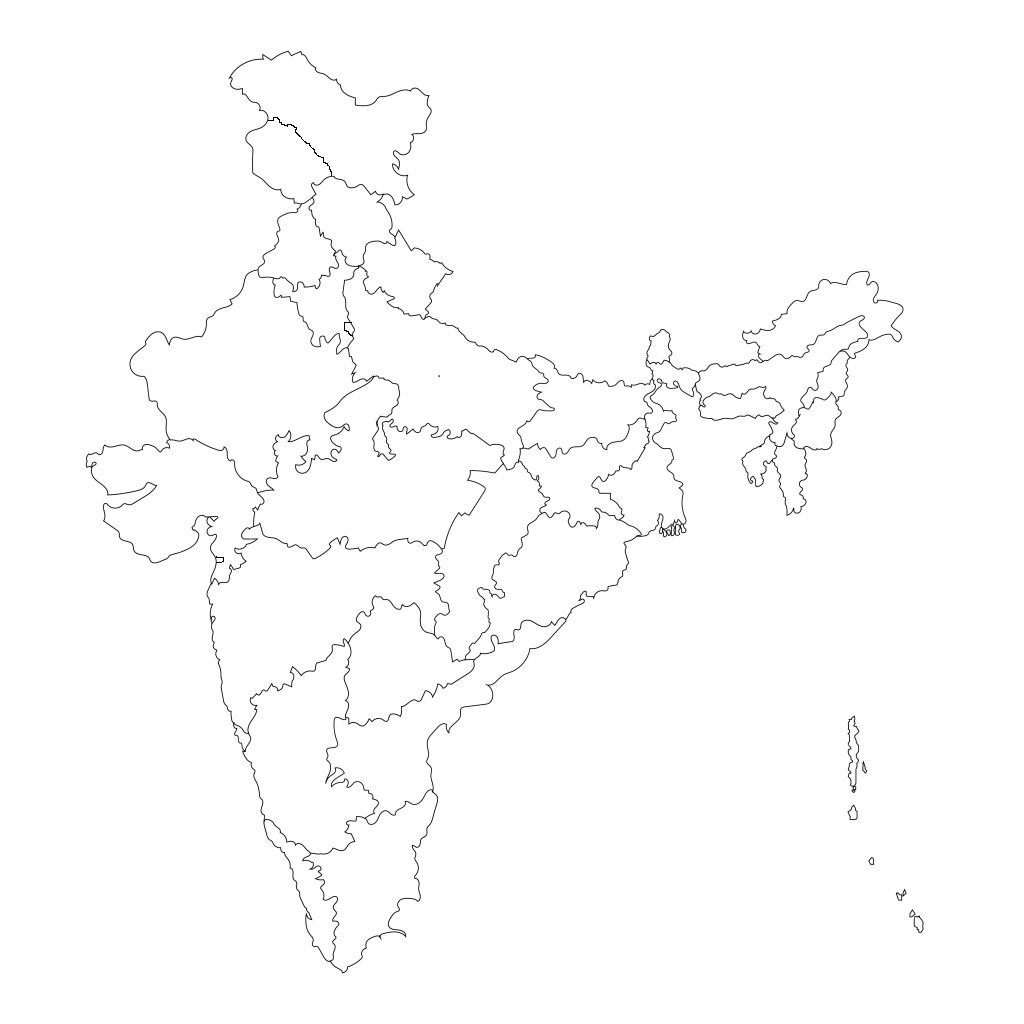
You are given a simplified map of India, which have the states and their borders. How will you do it if you only have four colours? You have to fill every state of India with no two adjacent states share the same colour.
DSATUR Algorithm
Here comes the DSATUR algorithm. An algorithm used to solve graph colouring problems.
The “degree of saturation” of a state (or vertex) is the number of different colours used by its neighbouring states.
The DSATUR algorithm colours the states of a graph by selecting the state with the highest degree of saturation at each step.
If there is a tie, the vertex with the highest degree is chosen.
The saturation degree of a vertex is the number of different colours used by its adjacent vertices, but the degree of a vertex in a graph is the number of edges connected to it. But in a map of India or any other country, the regions are there, but not the edges.
This approach often results in an efficient colouring with a minimal number of colours.
.
History of four-colour problem
The problem was first posed in 1852 by Francis Guthrie, a British mathematician. While studying the map of counties in England, Guthrie noticed that only four colours were needed to color the regions so that no two adjacent regions shared the same color. He conjectured that this was true for any map.
Guthrie’s conjecture was brought to the attention of Augustus De Morgan, a noted mathematician. De Morgan communicated the problem to his colleagues, and it became a topic of interest in the mathematical community.
In 1879, Alfred Kempe provided what was initially thought to be a proof of the Four-Color Theorem. However, it was later found to be incorrect. Kempe’s work was notable for its innovative approach but ultimately did not solve the problem.
The first correct proof of the Four-Color Theorem was completed in 1976 by Kenneth Appel and Wolfgang Haken. They used a combination of theoretical and computer-assisted methods. Their proof was the first major theorem to be proven with the aid of a computer. It involved checking a large number of cases using a computer, which was a significant breakthrough in both mathematics and computer science.
.
DSATUR Algorithm for Four-Color Problem
- Initialization
- Represent the graph as an adjacency list where each vertex/state corresponds to a state.
- Initialize the color for each vertex/state as -1 (indicating uncoloured).
- Degree Calculation
- Calculate the saturation degree of each vertex/state (number of direct connections).
- Select the Starting Vertex
- Choose the vertex/state with the highest saturation degree to start.
- Color the Vertex
- Assign the first color to the selected vertex/state.
- Update Saturation Degrees
- For each uncoloured adjacent vertex, update the saturation degree. The saturation degree of a vertex/state is the number of different colours used by its neighbouring vertices.
- Select the Next Vertex/state
- Choose the vertex/state with the highest saturation degree.
- If there is a tie (multiple vertices have the same highest saturation degree), select the vertex with the highest degree. Or
- If there is a tie (multiple states have the same highest saturation degree), then select anyone.
- Assign Color
- For the selected vertex/state, assign the limited available color that is not used by its adjacent vertices.
- Repeat
- Repeat steps 5-7 until all vertices/states are coloured.
- Output
- Print the color assigned to each vertex/state.
.
Example –
In India’s map, the highest saturation degree is 9 of Uttar Pradesh. The second highest saturation degree is 7 which is for Assam.
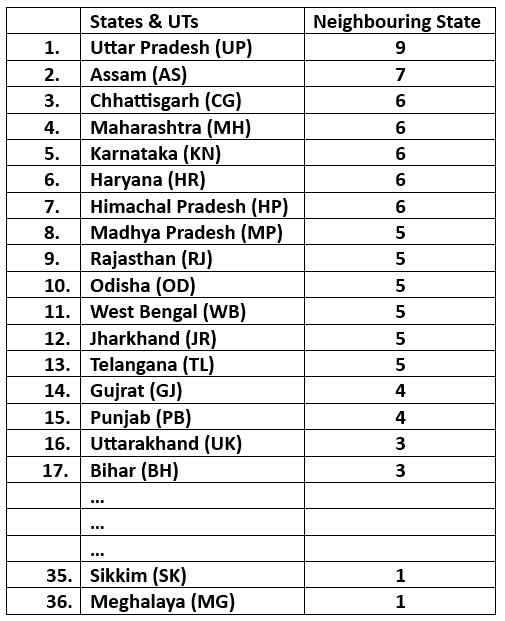
The adjacency list is –
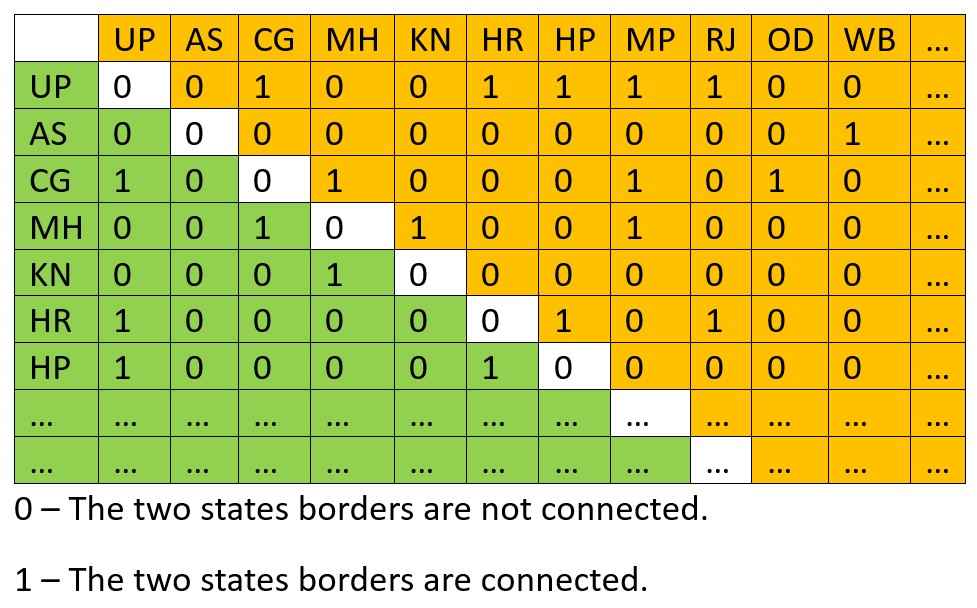
The India has 28 states and 8 union territories, so its not possible to make full table and adjacency list. But I have drawn some part of it so that you can understand how they are build.
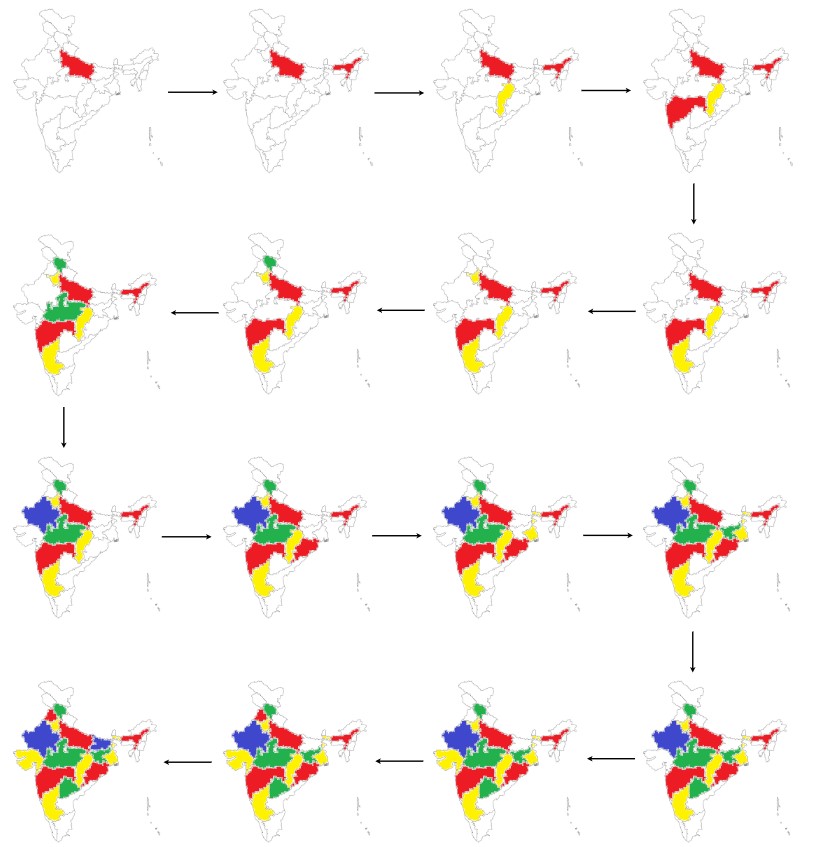
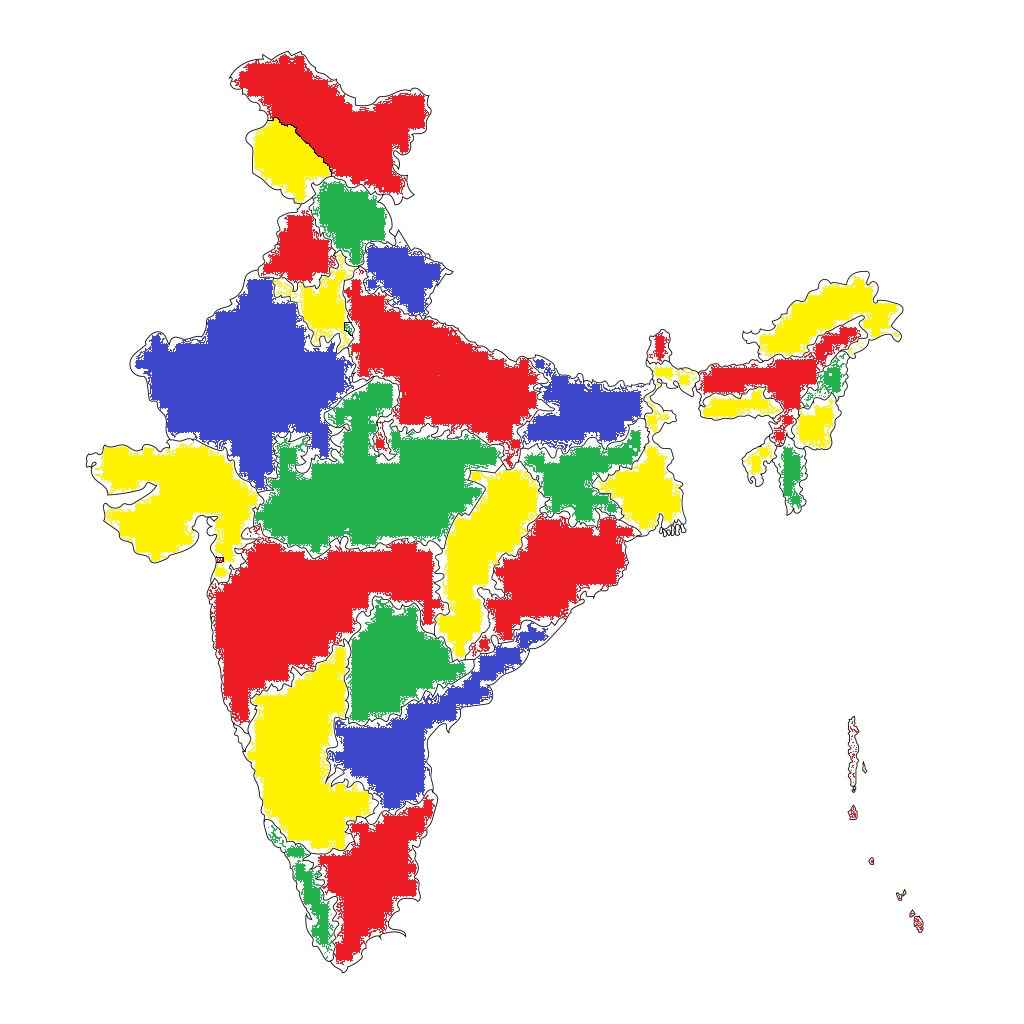
Map colour like this –
.
.
The main area is filled with colours and the four-colour theorem is proved. We are not using fifth colour in any map.

.

.
Time Complexity of Four-Colour Algorithm
Initializing the adjacency matrix and colours array takes O(V2) time, where V is the number of vertices.
Calculating the degree of a vertex involves iterating through its neighbours, leading to a total of O(V2) time for all vertices.
Saturation degree operation is O(V) for each vertex, and thus, O(V2) overall.
The color assignment operation is O(V) for each vertex, leading to O(V2) overall.
Combining these operations, the dominant factor in the complexity is O(V2).
.
Space Complexity of Four-Colour Algorithm
the dominant factor in the space complexity is the adjacency matrix, which requires O(V2) space. Therefore, the overall space complexity of the DSATUR algorithm is O(V2).
.
Applications of the Four-Colour Theorem
- The most direct application of the theorem is in cartography, where it ensures that any map can be coloured with no more than four colours so that adjacent regions do not share the same color. This is useful in designing maps for various regions.
- Beyond maps, the theorem is applied in graph colouring problems where the goal is to color vertices of a graph such that no two adjacent vertices share the same color. This has applications in scheduling, resource allocation, and frequency assignment.
- In electronic circuit design, particularly in the layout of very large-scale integration (VLSI) circuits, graph colouring principles help in minimizing interference and optimizing the placement of components.
- The theorem aids in solving scheduling problems where tasks must be assigned to time slots or resources in such a way that no two conflicting tasks overlap, which can be mapped to graph colouring problems.
In various applications such as telecommunications and network design, graph colouring helps in managing and resolving conflicts or interferences by assigning resources in a non-conflicting manner.
BOOKS