


Q1 – Consider the dataset with six datapoints: {(𝒙𝟏, 𝒚𝟏), (𝒙𝟐, 𝒚𝟐), … ,(𝒙𝟔, 𝒚𝟔)}, where
 and the labels are given by 𝒚𝟏 = 𝒚𝟐 = 𝒚𝟓 = 1, and 𝒚𝟑 = 𝒚𝟒 = 𝒚𝟔 = −1. A hard margin linear support vector machine is trained on the above dataset.
Which ONE of the following sets is a possible set of support vectors?
(A) {𝒙𝟏, 𝒙𝟐, 𝒙𝟓}
(B) {𝒙𝟑, 𝒙𝟒, 𝒙𝟓}
(C) {𝒙𝟒, 𝒙𝟓}
(D) {𝒙𝟏, 𝒙𝟐, 𝒙𝟑, 𝒙𝟒}
(GATE DS&AI 2024)

Q3 – Euclidean distance based 𝑘-means clustering algorithm was run on a dataset of 100 points with 𝑘=3. If the points [1; 1] and [−1; 1] are both part of cluster 3, then which ONE of the following points is necessarily also part of cluster 3?
(A) [0; 0]
(B) [0; 2]
(C) [2; 0]
(D) [0; 1]
(GATE DS&AI 2024)
Q6 – Consider the table below, where the (𝑖,𝑗)𝑡ℎ element of the table is the distance between points 𝑥𝑖 and 𝑥𝑗. Single linkage clustering is performed on data points, 𝑥1, 𝑥2, 𝑥3, 𝑥4, 𝑥5.
𝑥1 | 𝑥2 | 𝑥3 | 𝑥4 | 𝑥5 | |
𝑥1 | 0 | 1 | 4 | 3 | 6 |
𝑥2 | 1 | 0 | 3 | 5 | 3 |
𝑥3 | 4 | 3 | 0 | 2 | 5 |
𝑥4 | 3 | 5 | 2 | 0 | 1 |
𝑥5 | 6 | 3 | 5 | 1 | 0 |
Which ONE of the following is the correct representation of the clusters produced?

(GATE DS&AI 2024)
Q7 – Consider the two neural networks (NNs) shown in Figures 1 and 2, with 𝑅𝑒𝐿𝑈 activation (𝑅𝑒𝐿𝑈(𝑧) = max{0, 𝑧}, ∀𝑧 ∈ ℝ). ℝ denotes the set of real numbers. The connections and their corresponding weights are shown in the Figures. The biases at every neuron are set to 0. For what values of 𝑝, 𝑞, 𝑟 in Figure 2 are the two NNs equivalent, when 𝑥1, 𝑥2, 𝑥3 are positive?
Figure 1
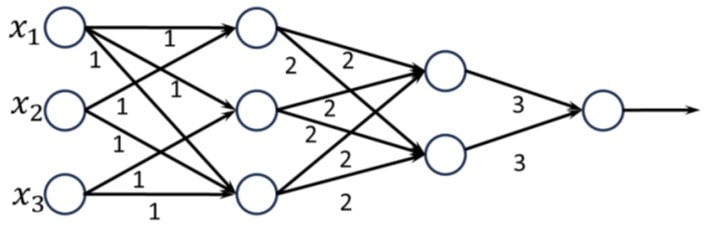
Figure 2

(A) 𝑝=36, 𝑞=24, 𝑟=24
(B) 𝑝=24, 𝑞=24, 𝑟=36
(C) 𝑝=18, 𝑞=36, 𝑟=24
(D) 𝑝=36, 𝑞=36, 𝑟=36
(GATE DS&AI 2024)
Q8 – Consider the following figures representing datasets consisting of two-dimensional features with two classes denoted by circles and squares.

Which of the following is/are TRUE?
(A) (i) is linearly separable.
(B) (ii) is linearly separable.
(C) (iii) is linearly separable.
(D) (iv) is linearly separable.
(GATE DS&AI 2024)
Ans – (A, D)
Explanation – Option A – (i) and option D – (iv) are linearly separable because a line can separate the circles and squares.

Q10 – Given the two-dimensional dataset consisting of 5 data points from two classes (circles and squares) and assume that the Euclidean distance is used to measure the distance between two points. The minimum odd value of 𝑘 in 𝑘-nearest neighbor algorithm for which the diamond (⋄) shaped data point is assigned the label square is ______.
